Career 15 Vacancies 250+ Employees
Career 15 Vacancies 250+ Employees
InfoGuard AG (Headquarter)
Lindenstrasse 10
6340 Baar
Switzerland
InfoGuard AG
Stauffacherstrasse 141
3014 Bern
Switzerland
InfoGuard Deutschland GmbH
Landsberger Straße 302
80687 Munich
Germany
Malware Cloaking: the Growing Threat of Manipulated Command Lines
Many detection mechanisms and investigation techniques focus heavily on analysing the command lines of processes. Increasingly, we are seeing these command lines being modified by malware – see for example the Rohrschach malware or the BlackCat attack pattern. This blog post explores why this is so easy to do, despite all the protective measures.
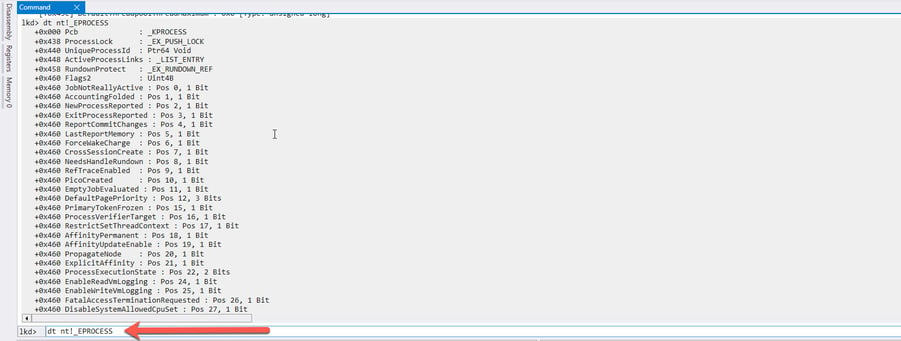
Windows manages processes in what are known as “_EPROCESS structures”, which contain metadata about processes. The exact structure of these kernel objects can be easily viewed in the Windows Debugger.
Kernel objects are separately protected from modification by PatchGuard on all 64-bit Windows systems, so PatchGuard would throw a blue screen and reboot the system if malware structures in _EPROCESS blocks were modified. Yet how is it still possible for malware to modify metadata about a process, in this case the command line?
The answer is that the command line of a process is not managed directly in the _EPROCESS structure, but in what is known as the “Process Environment Block”. This is located in the memory area of the process itself. Write permissions exist for this area, which additionally are not monitored by PatchGuard.
How to find and modify command lines
A practical example shows where the command lines of the processes are located and how easily they can be modified. I will try to describe the procedure in such a way that you, as an interested reader, can perform the experiment yourself. All you need is for a Windows Debugger to be installed. You then attach this Debugger to the Windows core via the “Open” dialog.
The first step is to launch a process whose command line is to be modified. To do this, we open PowerShell. This is because we will be using a PowerShell script that is also used by attackers who are believed to be associated with the BlackCat ransomware.
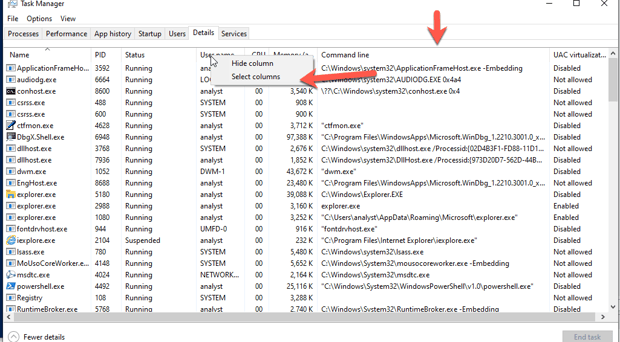
We also open the Task Manager and make the command line column visible.
We now use Windows Debugger to locate the _PEB of the Powershell process.
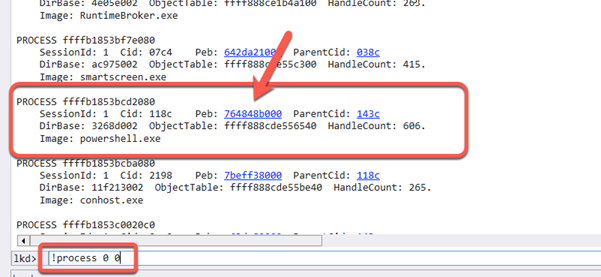
Conveniently, the Windows Debugger provides direct links to important structures such as the _PEB. A simple click will obtain a summary of the objects of interest referenced in the _PEB. It is important here that the context of the process is entered (red box) to display the _PEB before the _PEB is called. This shows that we have now moved away from the memory area monitored by PatchGuard.

To de-reference the _PEB cleanly, we now click the blue address by the text “PEB at”.
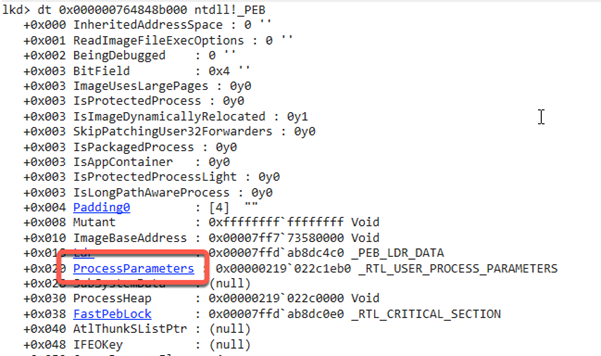
The command line is not linked directly under the _PEB, but managed in a structure called ProcessParameters of the type RTL_USER_PROCESS_PARAMETERS. A simple click lets us take a closer look at this structure.

As already touched on, the references to two Unicode buffers containing the ImagePathName and the CommandLine of the process are located here. Clicking the blue CommandLine link followed immediately by the “Raw View” link describes this buffer in more detail.
![]()
![]()
So, in the illustrated example, the actual buffer is located at address 0x219022c256c in the virtual memory of the PowerShell process. Another way of trying this is to decode the data at this memory address as Unicode.

Intuitively, it should now be possible to modify this data. After all, the Windows Debugger runs under system privileges and should have access to all memory. We can use the “eu” command to populate memory areas with Unicode.
![]()
Unfortunately, we get an error message at this point. I used Windows 10 for this experiment, which includes measures that prevent a simple modification of the _PEB. However, the reason for this is not down to security, but to avoid parallel access to the data structure by various other programs and the Windows core, which could otherwise lead to deadlocks. After all, the _PEB is also home to frequently changed variables such as the current working directory. So how does malware still manage to modify this data?
The answer is quite simple: whenever the _PEB is to be written, write protection must be enabled beforehand. This is realised by what is known as a “critical section” called FastPebLock. Thus, if a thread wants to write to the _PEB, exclusive write access must be established via the FastPebLock structure beforehand. For example, the Windows API provides the function “RtlEnterCriticalSection” for this purpose.
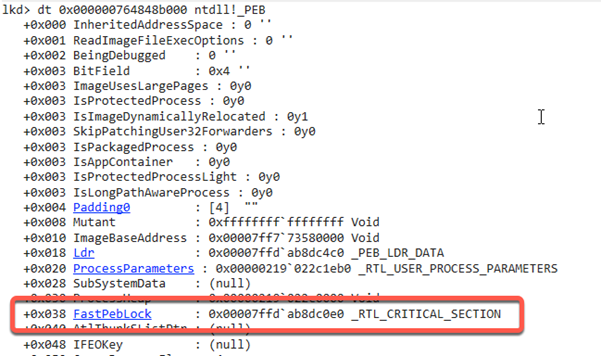
Thus, if malware wants to modify the _PEB, the lock must be established as a priority. Now let’s have a look at the Masquerade-PEB.ps1 script. This allows the command line of the PowerShell process in which it is called to be changed to any value.

It is clear in the code that the PEB lock is obtained before any changes can occur.

Now we can easily test the script by fully loading it into the PowerShell window. The command line can then be modified.

Launching the task manager again shows that the command line of the PowerShell process has indeed been modified.
![]()
The bottom line – don’t forget Windows Debugger
During both monitoring and investigations, it must always be clear which process parameters are easy to modify and which are difficult. For SOC analysts and incident responders, it is definitely worth opening the Windows Debugger every now and then to better understand memory and the Windows core.
Would you like more technical insights as well as tips from me and my team? Subscribe easily to our blog updates and never miss an article!
Blog

SWIFT CSCF v2025 Increases the Pressure: Only Cyberresilient is Compliant

Zero Trust Maturity Model 2.0: Security in a Dynamic Future

